

Integrating Event Collectors with Databricks Zerobus
Proof of concept using Grafana Alloy and Databricks Zerobus to collect AWS EKS pod logs into Delta tables.
databricks
zerobus
grafana-alloy
Using Grafana Alloy and Zerobus to collect AWS EKS pod logs
How easy is it to integrate an open source telemetry collector for a complicated data source like AWS EKS pod logs? Traditionally, if you wanted to store these types of logs within Databricks for cybersecurity, observability, or debugging, you’d need to integrate with AWS S3 (leveraging CloudWatch or the cloud storage upload mechanism of your collector). Can an alternative approach do better?
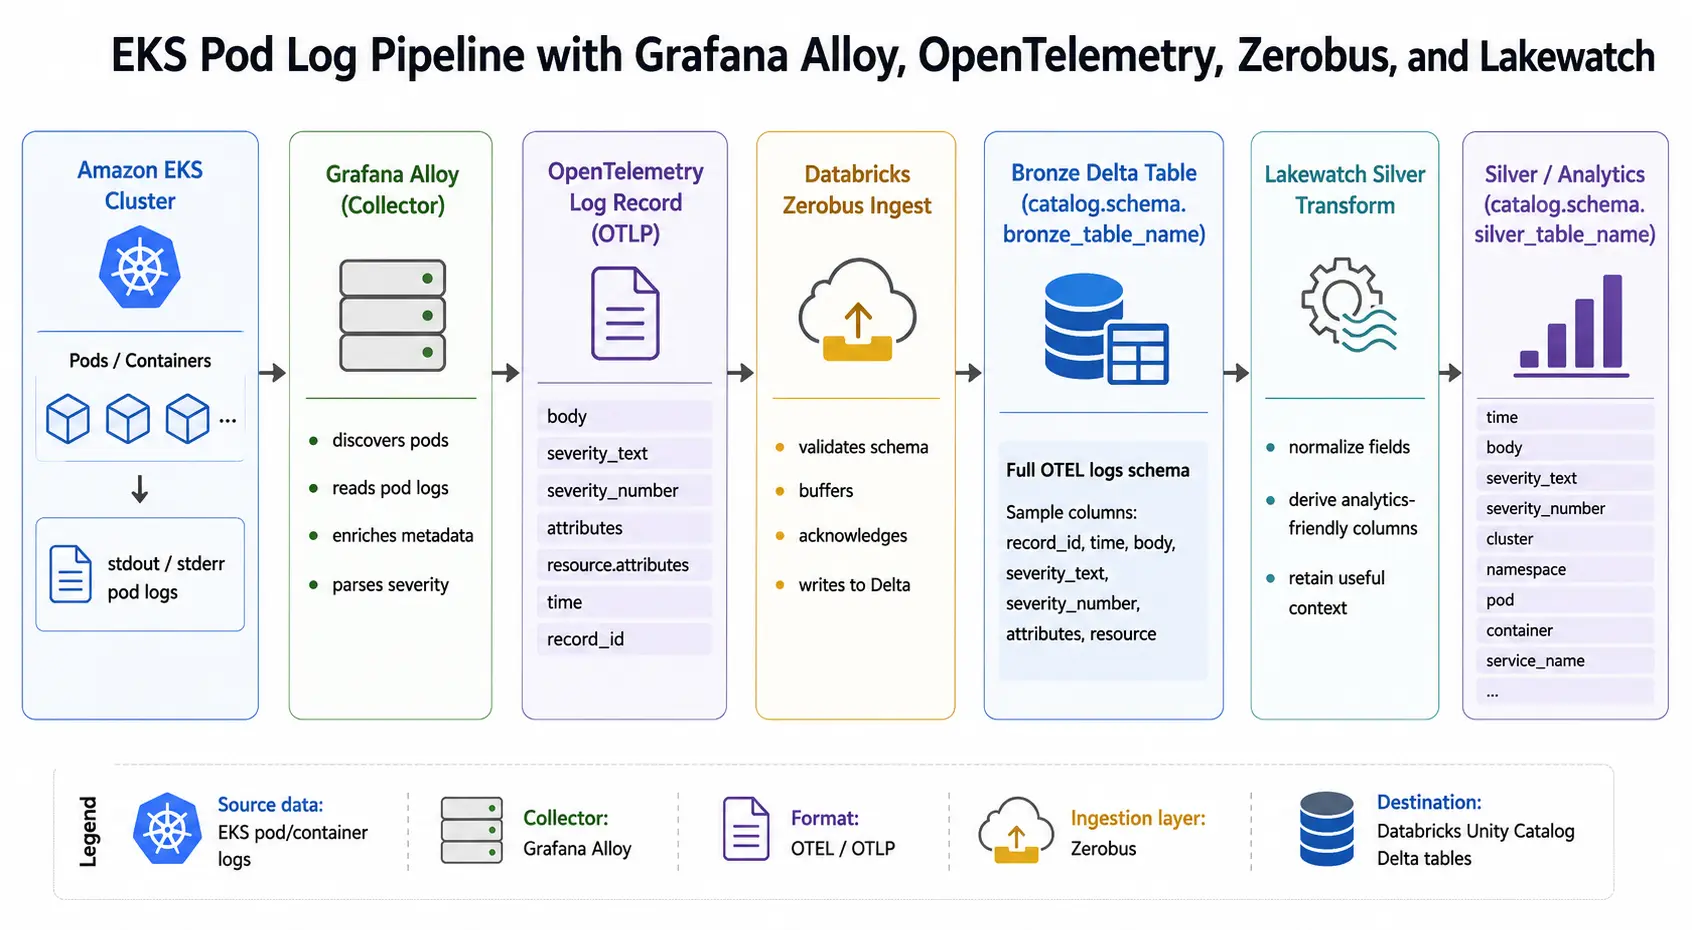
As described by Databricks, “Zerobus Ingest is a push-based ingestion API that writes data directly into Unity Catalog Delta tables. It is a serverless connector that automatically scales to handle incoming connections. It does not require configuring partitions or managing brokers.”
Some of the benefits of this approach:
If you’re interested in following along and implementing this in your own environment, here are the tools and configurations you need:
kubectlhelmeksctlNow we can set up an EKS cluster in AWS. This can be done on your terminal command line via eksctl, a command-line tool for creating and managing Amazon EKS clusters – or directly in the AWS EKS console. We decided to use eksctl for more control and debugging.
eksctl create cluster --name zerobus-grafana-alloy --region us-east-1 \
--nodes 2 --node-type t3.mediumNow that we’ve covered the setup, we can dive into the more interesting parts. Let’s start with collection. How do we actually get access to the logs that EKS pods are producing? Unfortunately, you can’t go directly into the EKS console and download logs. You have to create a log pipeline to retrieve the data.
We looked into a couple of options: First was the native approach of using AWS CloudWatch. When working with Fargate, this requires a log forwarder like Fluent Bit. This can be a good option if the logs would just be kept in AWS, but we want to put them into Databricks for durable storage, centralized querying, schema enforcement, Delta table history, and downstream analytics.
Another option, and the one we ultimately chose, is using the Grafana Alloy service as a collector – a component in a logging pipeline that gathers data from a source system and forwards it to a destination. Grafana Alloy runs inside the EKS cluster, discovers pods, reads the container log output, adds K8s context, and sends logs to the next stage of the pipeline. A key advantage of using a collector is that it makes log collection continuous.
The next decision was how the logs should be represented once they leave the collector. For that, we used OpenTelemetry logs and OpenTelemetry Protocol (OTLP). We chose OTLP for its schema stability. It’s less likely for ETL/ELT jobs to fail due to columns being modified in some way, it’s easier for analysts and downstream pipelines to reliably query data, and your data is predictable so you need less defensive logic.
For unpredictable sources, a common pattern is to land the raw payload in a single VARIANT column and parse it in the silver table. Zerobus OTLP ingestion doesn’t allow that: it requires the target table to use Databricks’ OTel schema for logs. Since OTLP already gives us a stable schema, this is not a problem.
Databricks provides a CREATE TABLE statement for OTel log ingestion to send data into Delta tables with a specific schema. The schema itself even has versioning (TBLPROPERTIES ('otel.schemaVersion' = 'v2')), which makes the target schema explicit instead of leaving each source to define its own shape. In our case, we set up the logs table to include severity, body, and resource attributes. Note that while OTel logs schema defines a common structure, some fields may be null due to different log sources providing different levels of detail. An EKS pod log may include the raw message in body and source context in attributes while severity_number, severity_text, event_name, and service_name remain null, but those can be populated and enriched in silver and gold tables.
Check the Databricks OTel documentation for the logs table for more information on OpenTelemetry configuration and the exact schema that is needed for the logs table.
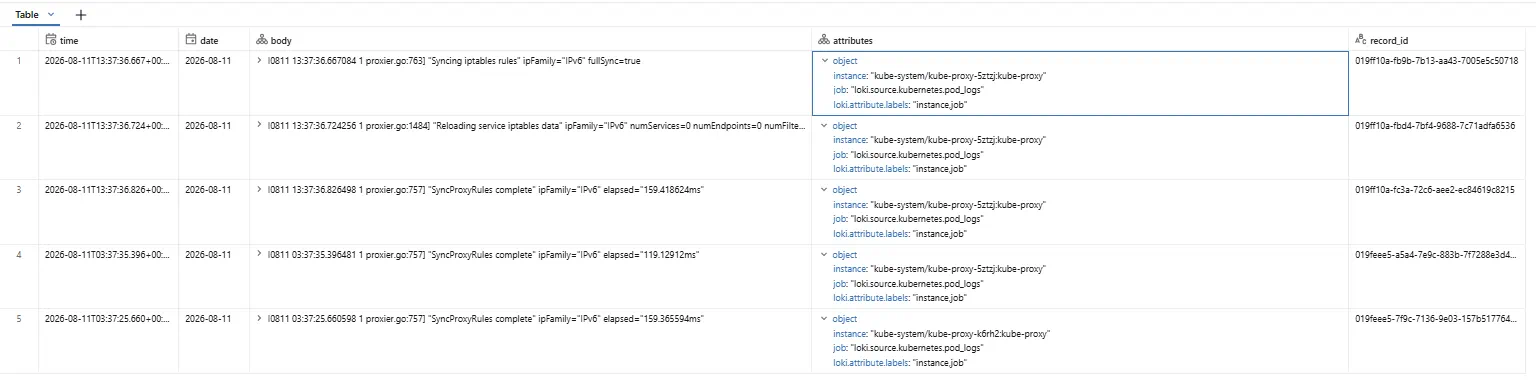
Sample Bronze table output showing EKS pod logs collected by Grafana Alloy and ingested into Databricks through Zerobus
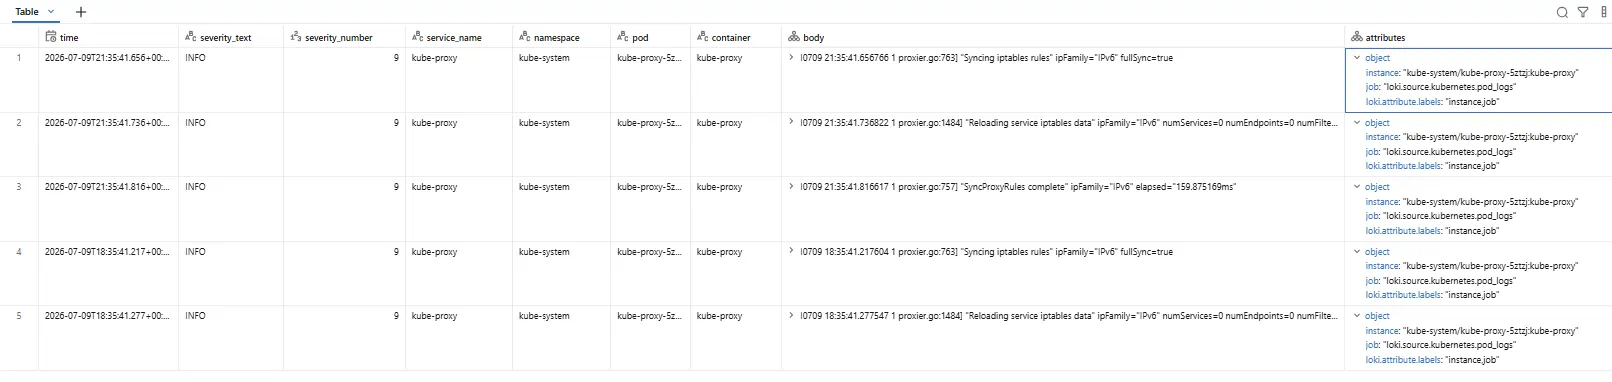
Sample Silver table output showing key EKS pod log fields populated and normalized from the Bronze OTel data
Since we’re creating a bronze table, a couple of straightforward permissions need to be granted to the application ID of the service principal:
%sql

GRANT USE CATALOG ON CATALOG <catalog> TO `<application-id>`;
GRANT USE SCHEMA ON SCHEMA <catalog>.<schema> TO `<application-id>`;
GRANT MODIFY, SELECT ON TABLE <catalog>.<schema>.<table> TO `<application-id>`;A Helm chart is a reusable package for deploying applications to Kubernetes. For this POC, the Grafana Alloy Helm chart creates the Kubernetes resources needed to run Alloy in the EKS cluster. Grafana Alloy is configured through alloy-values.yaml, where you can set batch size, client ID, client secret, and authentication. It’s also where you name the catalog, Unity Catalog schema (not table schema), and the bronze table for output.
Here are the Zerobus-specific settings – but this is not the full configuration. For the full configuration, see the Appendix.
otelcol.processor.batch "default" {
  timeout         = "5s"
  send_batch_size = 100

  output {
    logs = [otelcol.exporter.otlp.zerobus.input]
  }
}

otelcol.auth.oauth2 "zerobus" {
  client_id     = "<client_id>"
  client_secret = "<client_secret>"
  token_url     = "https://<databricks_workspace_url>/oidc/v1/token"
  scopes        = ["all-apis"]

  endpoint_params = {
    "resource" = ["api://databricks/workspaces/<databricks_workspace_id>/zerobusDirectWriteApi"],
    "authorization_details" = ["[{\"type\":\"unity_catalog_privileges\",\"privileges\":[\"USE CATALOG\"],\"object_type\":\"CATALOG\",\"object_full_path\":\"<catalog>\"},{\"type\":\"unity_catalog_privileges\",\"privileges\":[\"USE SCHEMA\"],\"object_type\":\"SCHEMA\",\"object_full_path\":\"<catalog>.<schema>\"},{\"type\":\"unity_catalog_privileges\",\"privileges\":[\"SELECT\",\"MODIFY\"],\"object_type\":\"TABLE\",\"object_full_path\":\"<catalog>.<schema>.<bronze_table_name>\"}]"],
  }
}

otelcol.exporter.otlp "zerobus" {
  client {
    endpoint = "<databricks_workspace_id>.zerobus.<aws_region>.cloud.databricks.com:443"
    auth     = otelcol.auth.oauth2.zerobus.handler

    headers = {
      "x-databricks-zerobus-table-name" = "<catalog>.<schema>.<bronze_table_name>",
    }

    compression = "gzip"
  }
}
Excerpt from alloy-values.yaml
Add the Grafana Helm chart, install it, and apply our configurations:
# One time setup

# Add Grafana Helm chart repository so Helm knows where to download the chart
helm repo add grafana https://grafana.github.io/helm-charts

# Expected result: Helm should confirm that the grafana repo was added

# First install

# Install Grafana Alloy into EKS cluster using the Grafana Alloy Helm chart.
# Release name is Alloy, we deploy it into monitoring namespace, and it uses
# the setting from the alloy-values.yaml we create
helm install alloy grafana/alloy --namespace monitoring --create-namespace \
  -f alloy-values.yaml

# Expected result: Helm should show that the release was deployed successfully.
# In EKS, you should see Alloy resources created in the monitoring namespace.

# If you later want to update and apply the config changes in alloy-values.yaml:

helm upgrade alloy grafana/alloy --namespace monitoring -f alloy-values.yaml

# Expected result: Helm should show that the release was upgraded successfully.

kubectl rollout restart daemonset/alloy -n monitoring

# Expected result: Existing Alloy pods terminate and new Alloy pods start.
Once deployed, monitor the output:
# Watch the pods in monitoring namespace in real-time
kubectl get pods -n monitoring -w

# Expected result: Alloy pods should move into a Running state. Since Alloy runs
# as a DaemonSet, there should typically be one Alloy pod per Kubernetes node.

# Show logs from a specific Alloy pod (optional flag for newer logs: --since=2m)
kubectl logs -n monitoring <pod-name>

# Expected result: You should see Alloy startup logs, component initialization
# logs, and ideally no authentication, permission, schema, or export errors.
# This command is useful for confirming that Alloy is running and for debugging
# issues with log collection or export to Zerobus.
Verify that the Alloy pod logs show no config, authentication, permission, schema, or connection errors. Then confirm new rows are landing in the Databricks table.
When debugging, temporarily add an otelcol.exporter.debug block in the configuration file to inspect the log records that Alloy is processing and include debugging in the output of the batch processor section. The debug exporter is experimental, so you must also set stabilityLevel to experimental while it’s enabled. When you’re done, remove the debug block and reset stabilityLevel to generally-available.
One important detail is the authorization_details block used for Databricks OAuth. Unity Catalog privilege names must use spaces – USE CATALOG and USE SCHEMA – not underscores. These values should match the privilege names shown in Databricks SHOW GRANTS output.
If eksctl fails with a token-related error even after aws sts get-caller-identity succeeds, you can fall back to exporting temporary AWS credentials directly from the configured profile. Run aws configure export-credentials --profile <profile_name>, then set AWS_ACCESS_KEY_ID, AWS_SECRET_ACCESS_KEY, and AWS_SESSION_TOKEN in your terminal session before retrying the eksctl command.
The namespace where the collector runs should also be excluded from log discovery. In this POC, Alloy ran in the monitoring namespace, so that namespace was dropped from discovery. This prevents Alloy from ingesting its own logs, which can create noisy feedback loops. When debug logging is enabled, this can cause log records to repeatedly contain previous log records, increasing payload size and potentially exceeding the gRPC message size limit.
For example, if Alloy runs in the monitoring namespace, the discovery relabel rule should include:
rule {
  source_labels = ["__meta_kubernetes_namespace"]
  regex         = "monitoring"
  action        = "drop"
}Scaling the nodegroup to zero stops EC2 costs while preserving all cluster config (Helm release, Alloy config, Databricks table/grants) so no redeployment is needed on resume.
# Find nodegroup name:
eksctl get nodegroup --cluster=zerobus-grafana-alloy --region=us-east-1

# Pause:
eksctl scale nodegroup --cluster=zerobus-grafana-alloy --region=us-east-1 \
  --name=<nodegroup-name> --nodes=0 --nodes-min=0 --nodes-max=3

# Confirm:
kubectl get nodes

# Wait for nodes to fully disappear – Ready,SchedulingDisabled is a normal
# in-progress state, not stuck.

# Resume:
eksctl scale nodegroup --cluster=zerobus-grafana-alloy --region=us-east-1 \
  --name=<nodegroup-name> --nodes=2 --nodes-min=1 --nodes-max=3
kubectl get nodes
kubectl get pods -n monitoringThe EKS control plane (~$0.10/hr) keeps running even at zero nodes. For pauses longer than a few days, a full teardown is more economical:
eksctl delete cluster --name zerobus-grafana-alloy --region us-east-1At this point, the EKS pod logs are being collected by Grafana Alloy, shaped as OpenTelemetry log records, and ingested into a Databricks Bronze Delta table through Zerobus. From there, you’re able to write a pipeline to create silver and/or gold tables depending on the analytics use case.
We used Lakewatch, Databricks’ SIEM platform, and plugged in our existing bronze table logs to create a standardized and easily queryable silver table, using a simple configuration-driven setup.
For more information on Lakewatch, info on presets, and other examples, check out the Lakewatch documentation.
NOTE: For the configuration below, sensitive values such as the Databricks client ID and client secret should not be hard-coded directly in alloy-values.yaml. In production, store them in a secure secret manager such as AWS Secrets Manager and inject them into the Alloy deployment at runtime.
alloy:
  stabilityLevel: generally-available
  configMap:
    content: |
      discovery.kubernetes "pods" {
        role = "pod"
      }

      discovery.relabel "pod_logs" {
        targets = discovery.kubernetes.pods.targets

        rule {
          source_labels = ["__meta_kubernetes_namespace"]
          regex         = "monitoring"
          action        = "drop"
        }
      }

      loki.source.kubernetes "pod_logs" {
        targets    = discovery.relabel.pod_logs.output
        forward_to = [otelcol.receiver.loki.default.receiver]
      }

      otelcol.receiver.loki "default" {
        output {
          logs = [otelcol.processor.batch.default.input]
        }
      }

      otelcol.processor.batch "default" {
        timeout         = "5s"
        send_batch_size = 100

        output {
          logs = [otelcol.exporter.otlp.zerobus.input]
        }
      }

      otelcol.auth.oauth2 "zerobus" {
        client_id     = "<client_id>"
        client_secret = "<client_secret>"
        token_url     = "https://<databricks_workspace_url>/oidc/v1/token"
        scopes        = ["all-apis"]

        endpoint_params = {
          "resource" = ["api://databricks/workspaces/<databricks_workspace_id>/zerobusDirectWriteApi"],
          "authorization_details" = ["[{\"type\":\"unity_catalog_privileges\",\"privileges\":[\"USE CATALOG\"],\"object_type\":\"CATALOG\",\"object_full_path\":\"<catalog>\"},{\"type\":\"unity_catalog_privileges\",\"privileges\":[\"USE SCHEMA\"],\"object_type\":\"SCHEMA\",\"object_full_path\":\"<catalog>.<schema>\"},{\"type\":\"unity_catalog_privileges\",\"privileges\":[\"SELECT\",\"MODIFY\"],\"object_type\":\"TABLE\",\"object_full_path\":\"<catalog>.<schema>.<bronze_table_name>\"}]"],
        }
      }

      otelcol.exporter.otlp "zerobus" {
        client {
          endpoint = "<databricks_workspace_id>.zerobus.<aws_region>.cloud.databricks.com:443"
          auth     = otelcol.auth.oauth2.zerobus.handler

          headers = {
            "x-databricks-zerobus-table-name" = "<catalog>.<schema>.<bronze_table_name>",
          }

          compression = "gzip"
        }
}Read more about the latest and greatest work Rearc has been up to.
Proof of concept using Grafana Alloy and Databricks Zerobus to collect AWS EKS pod logs into Delta tables.

LLM applications have a semi-infinite attack surface, and they are notoriously hard to secure without breaking the user experience.

Recently, articles surrounding the supposed dangers of an open source abliteration tool called Heretic, along with legal notice being served to its creator, have inspired me to speak out for two reasons.
A step-by-step guide to deploying a Databricks workspace with Private Service Connect (PSC) on GCP and common pitfalls to avoid.
Tell us more about your custom needs.
We’ll get back to you, really fast
We will evaluate your query and respond within 2 business days.
Kick-off meeting
We will schedule a quick meeting to further understand your use case and start working toward a solution together!